
One day, you will need to monitor your database to analyse the performences, the number of queries, … Some tools exist !
pg_top
This is the cousin of the simple commant top, but applied to psql. It will show you the active connection.
See the process list
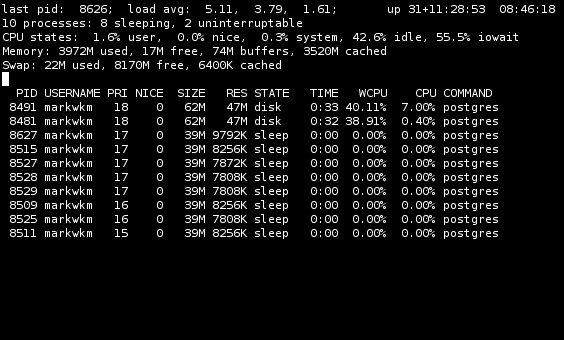
This is the default screen. To start pg_top:
pg_top [-d ] [-U ] [-W]
Where ‘-d’ specifies the database to connect to, ‘-U’ specifies the database user, and ‘-W’ will prompt for the password if a password is required to connect.
Current query
Use the ‘Q’ key and enter a PID once pg_top is started.
Query plan
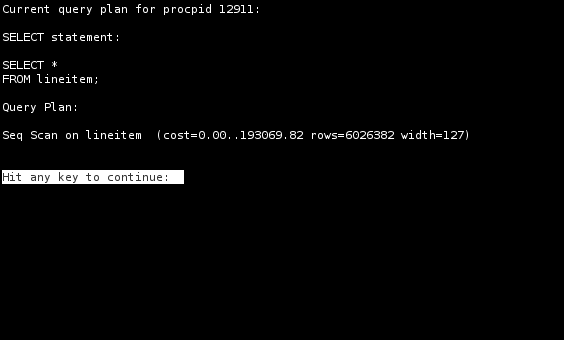
Use the ‘E’ key and enter a PID once pg_top is started. The ‘E’ commands runs ‘EXPLAIN’ and ‘EXPLAIN ANALYZE’ can be used by using the ‘A’ key followed by a PID.
Lock Aquired
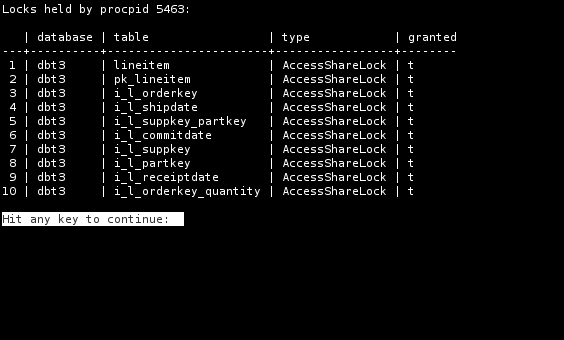
Use the ‘L’ key and enter a PID once pg_top is started.
Table Statistics
Use the ‘R’ key to display user table statistics. Use ‘t’ to toggle between displaying cumulative and differential statistics.
Index statistics
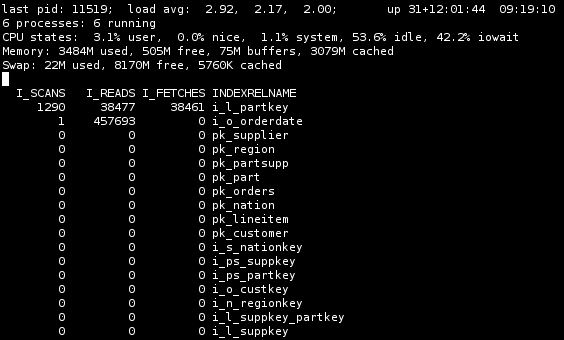
Use the ‘X’ key to display user index statistics. Use ‘t’ to toggle between displaying cumulative and differential statistics.
pg_activity
NAME
pg_activity - Realtime PostgreSQL database server monitoring tool
SYNOPSIS
pg_activity [-UphdC]
DESCRIPTION
       pg_activity is a htop like application for PostgreSQL server activity
       monitoring.
COMMAND-LINE OPTIONS
       -U USERNAME, --username=USERNAME
                 Database user name (default: $USER).

       -p PORT, --port=PORT
                 Database server port (default: "5432").

       -h HOSTNAME, --host=HOSTNAME
                 Database server host or socket directory (default: "localhost").

       -d DBNAME, --dbname=DBNAME
             Database name to connect to (default: "postgres").

       -C, --no-color
                 Disable color usage.

       --help
                 Show this help message and exit.

       --version
                 Show program's version number and exit.
ENVIRONMENT VARIABLES
       PGPASSWORD
             PostgreSQL password

       PGPASSFILE
             Path to .pgpass file (default is ~/.pgpass)
DISPLAY OPTIONS
       --no-database
                 Disable DATABASE.

       --no-client
                 Disable CLIENT.

       --no-cpu
                 Disable CPU%.

       --no-mem
                 Disable MEM%.

       --no-read
                 Disable READ/s.

       --no-write
                 Disable WRITE/s.

       --no-time
                 Disable TIME+.

       --no-wait
                 Disable W.
INTERACTIVE COMMANDS
       C     Activate/deactivate colors.
       r     Sort by READ/s, descending.
       w     Sort by WRITE/s, descending.
       c     Sort by CPU%, descending.
       m     Sort by MEM%, descending.
       t     Sort by TIME+, descending.
       Space Pause on/off.
       v     Change queries display mode: full, truncated, indented
       UP / DOWN Scroll process list.
       q     Quit
       +     Increase refresh time. Maximum value : 3s
       -     Decrease refesh time. Minimum Value : 1s
       F1/1  Running queries monitoring.
       F2/2  Waiting queries monitoring.
       F3/3  Blocking queries monitoring.
       h     Help page.
       R     Refresh.
NAVIGATION MODE
       UP    Move up the cursor
       DOWN  Move down the cursor
       k     Cancel the backend
       Space Back to activity
       q     Quit
EXAMPLES
       PGPASSWORD='mypassword' pg_activity -U pgadmin -h 127.0.0.1 --no-client
       -C

       pg_activity -h /tmp
@see : http://manpages.ubuntu.com/manpages/saucy/man1/pg_activity.1.html
You can also query the pg_stat_activity table of your database.
- http://www.postgresql.org/docs/9.2/static/monitoring-stats.html
- http://stackoverflow.com/questions/17654033/how-to-use-pg-stat-activity
- http://www.question-defense.com/2008/11/12/postgres-table-pg_stat_activity-table-fields-explained